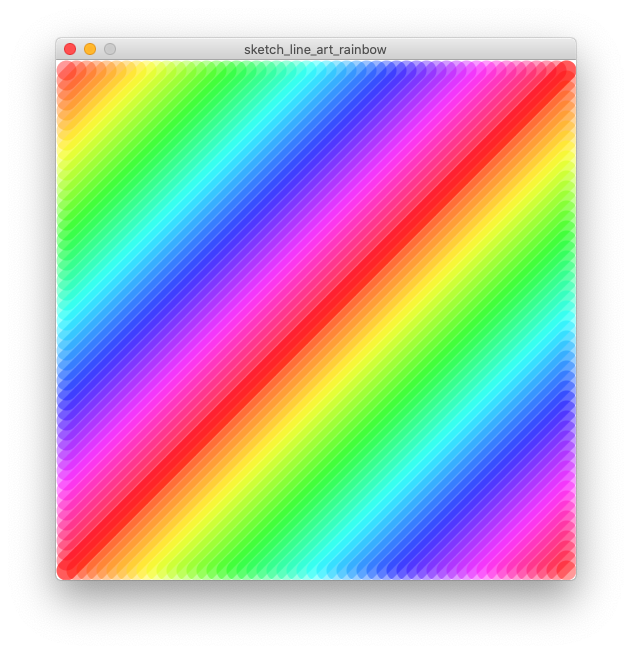
Create line art in processing, based on a 500×500 grid. Explore transparency effects.
Jonathan is constantly designing things, educating people, and always learning. He is professor of visualisation at the School of Computer Science and Electronic Engineering, Bangor University, U.K. He leads the Visualization, Data, Modelling and Graphics Group (VDMG), leads project rainbow and is an author of the Springer book "Five Design-Sheets" sketching design method.
Create line art in processing, based on a 500×500 grid. Explore transparency effects.
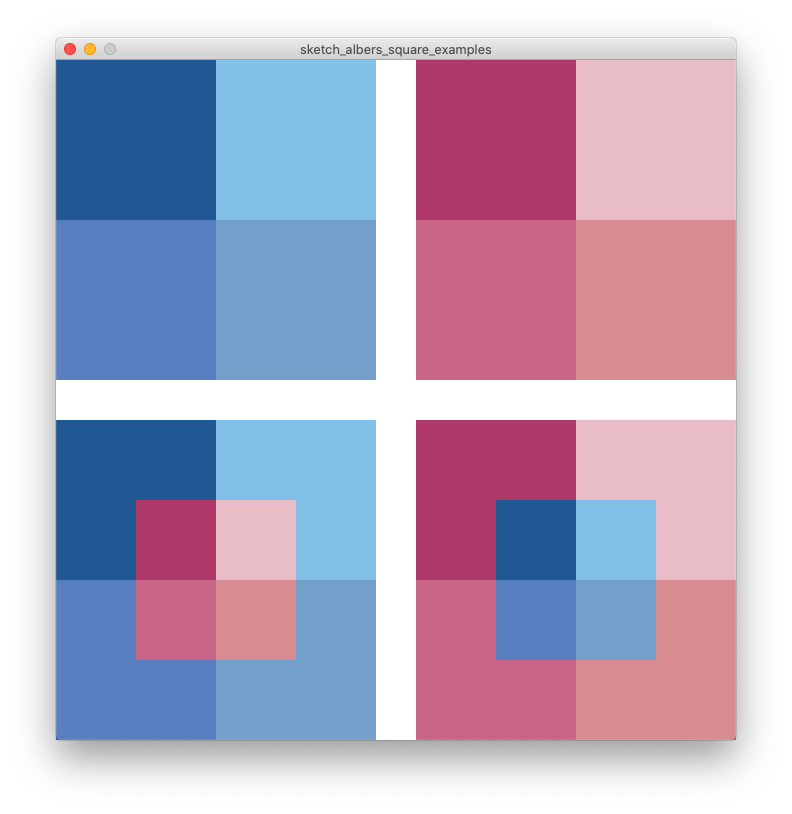
Create coloured squares (after Johannes Itten) to be printed and cut out, and coloured rectangles (after Josef Albers)
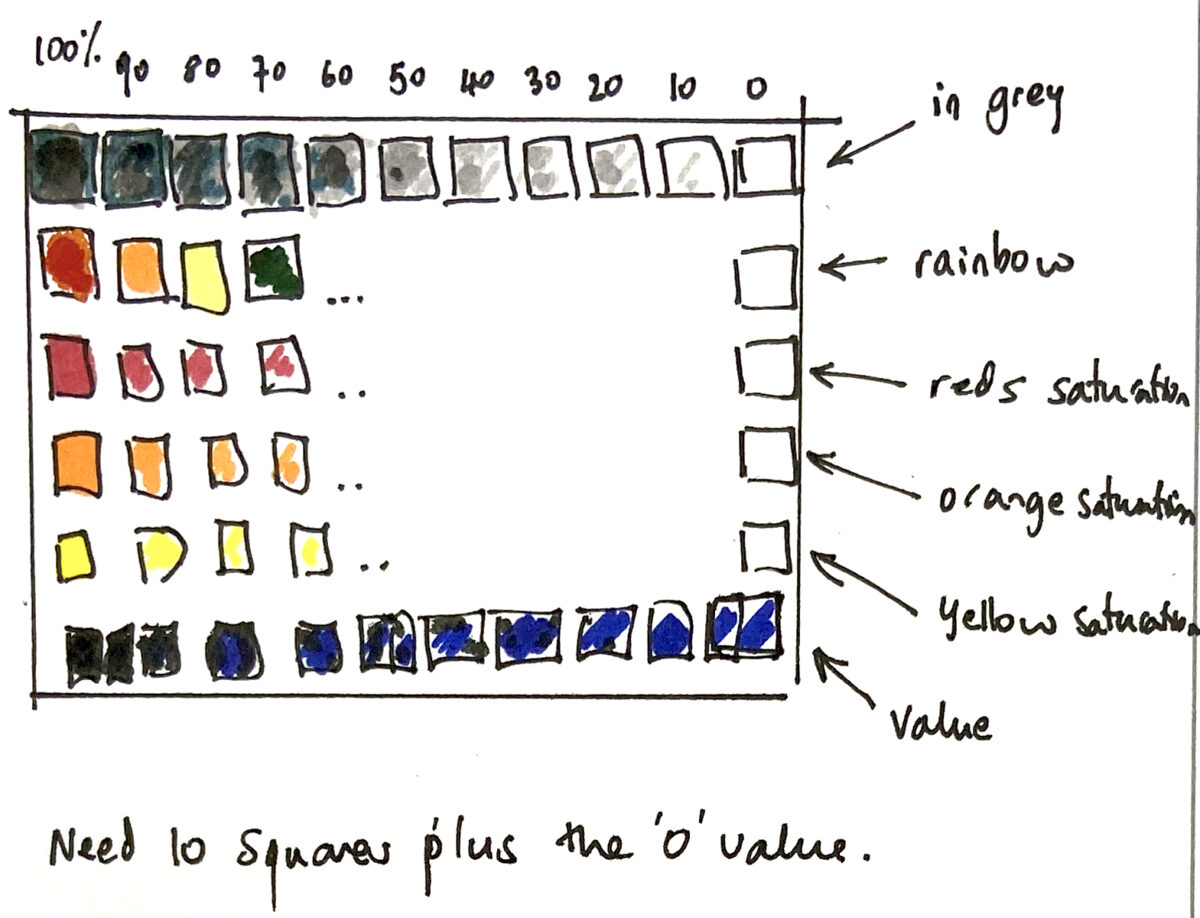
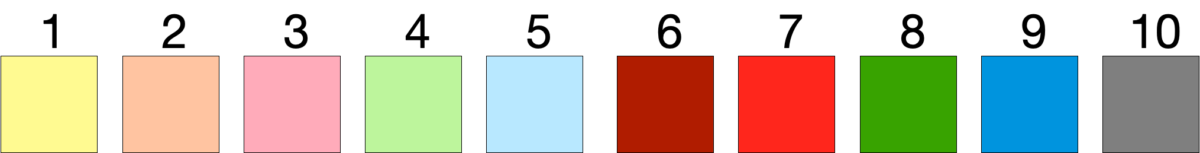
Create blocks of data that represent values. Then map these blocks from a simple array.
Critically think about colours; how they can be measured, the environment they are placed within and the emotions they bring.
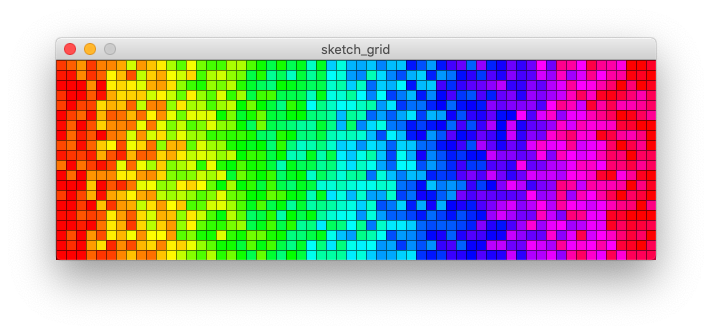
Learn how to create a grid of coloured shapes, plotted in Processing.
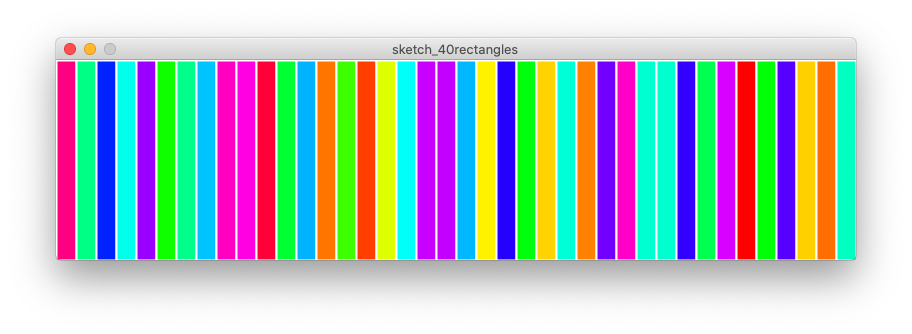
Create 40 coloured rectangles, use a for-loop, the critical thinking sheet, and do some code refactoring.
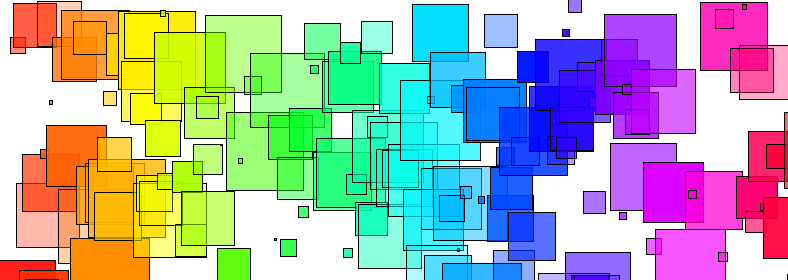
Learn how to use the HSB model, and plot hundreds of coloured squares with different effects.
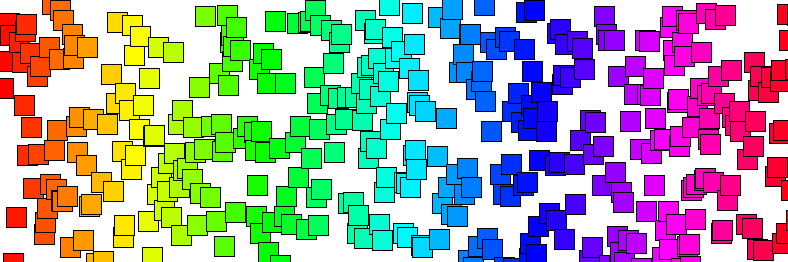
Create hundreds of coloured rectangles.
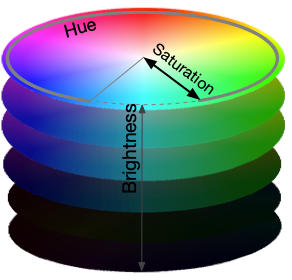
Learn about Hue, Saturation and Brightness colour model.
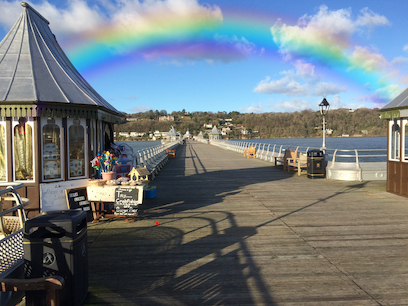
Create a rainbow in Photoshop and add it to an image.