This is part 2, and we continue the coding activity from part 1, and now vary the size of the rectangles and their transparency.
In this coding activity we extend the code of part 1 and create hundreds of rectangles that will show a spectrum of colour, with each rectangle showing a variety of effects, such as colour or transparency changes. We use the Processing library, and the Hue Saturation Brightness (HSB) colour model. This activity follows from previous activities and I suggest (if you have not already) that you follow the following three activities first:
- Setting up the programming environment,
- The activity to make a quick sketch before you code, and
- Hue Saturation Brightness activities first.
- Create a spectrum of coloured squares in Processing (part 1)
Step 1. Recap, and getting the basics working
Load Processing and the saved rectangles activity (part 1). Make sure you have gotton this far.
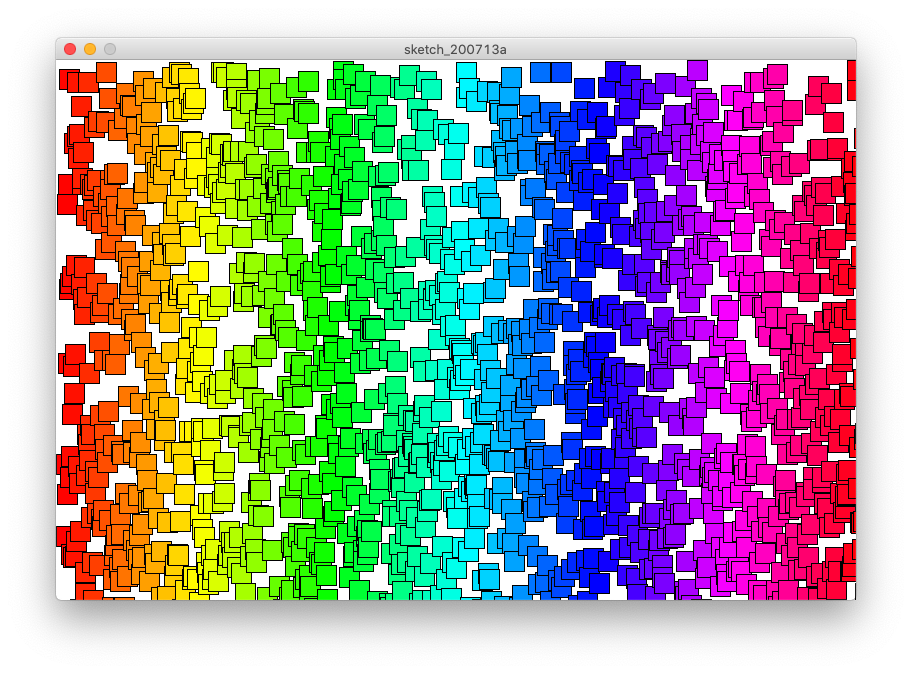
In part 1, we plot rectangles while the myX variable had a value less than the width. We incremented the myX variable every time we went round the loop, and changed the colour depending on the myX value. We defined the y position by a random amount (between 0 and height). This gives red squares on the left and purple on the right.
//Rectangles coloured by the spectrum
size(800,540);
background(255,255,255);
colorMode(HSB,800,100,100,100);
float myX=0;

while(myX<width){
  fill(myX,100,100);
  rect(myX,random(height),20,20);
  myX += 0.5;
}
Now we extend the code in several ways.
Step 2. Center and adapt the size of the rectangles
We first centre the rectangles. Currently the rectangles are plotted in positions defined by the top left hand corner. We use rectMode( mode ) to set how we define the location of the plotted rectangles. The mode can be either CORNER, CORNERS, CENTER, or RADIUS. See the processing website for a long description of each setting for rectMode. The default rectMode is CORNER, we will use CENTER to put the x,y position in the centre of the rectangle.
rectMode(CENTER);Let’s revisit the x and y variables. Before we just used myX, and set the y value when we needed it. Let us now define a myY variable:
float myY = 0;and set this to the random value every time we go round the loop.
myY = random(height);Now, let’s change the size of the rectangles every time we go round the while loop. To achieve this task, let us think about what we want:
- We need to use a random value to change the size of the squares.
- We want to have squares. So we’ll need to define a variable to hold the value such that the width and height of the rectangle is the same.
- We don’t want extremely small squares, so we need a minimum size.
Let us now set a few more variables. We need a variable for the minimum width of the rectangle (let’s set this initially to 1), another variable to set the maximum size (let’s set this to 80), and a final one to hold the current size (initially 0).
float myRectSizeMin = 1;
float myRectSizeMax = 80;
float myRectSize    = 0;
Every time we go round the while loop, we need to update the myRectSize, with a random value between the minimum and maximum value. We can achieve this as follows:
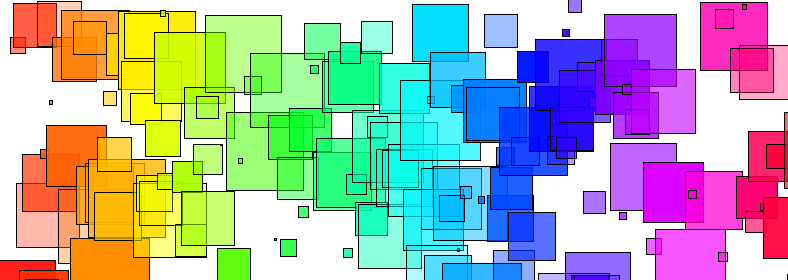
myRectSize = random(myRectSizeMin, myRectSizeMax);Note that (with the current set variables) this now gives us a random number between 1 up to (and not including) 80. To summarise so far, we now have the following code:
//Rectangles random sized, and coloured by the spectrum
size(800,540);
background(255,255,255);
colorMode(HSB,800,100,100,100);
rectMode(CENTER);
float myX=0;
float myY=0;
float mySizeAdapter=0;
float myRectSizeMin = 1;
float myRectSizeMax = 80;
float myRectSize    = 0;

while(myX<width){
  myRectSize = random(myRectSizeMin, myRectSizeMax);
  myY = random(height);
  fill(myX,100,100);
  rect(myX,myY,myRectSize,myRectSize);
  myX += 3;
}
Step 3. Adapt opacity
We have already setup the HSB colour mode to be colorMode(HSB,800,100,100,100); remember that this setting gives us the Hue range between 0 and 800, with each of Saturation, Brightness and Opacity between 0 and 100.
We need to define a variable to hold the opacity, let’s define the following:
float myOpacity = 0;Let’s set the opacity between 20 and 80. We don’t want it too translucent, otherwise it won’t be seen. We don’t want it too opaque because it will cover other rectangles. Every time round the loop we need to call the following:
myOpacity = random(20,80);And also set the fill to change the opacity, as follows:
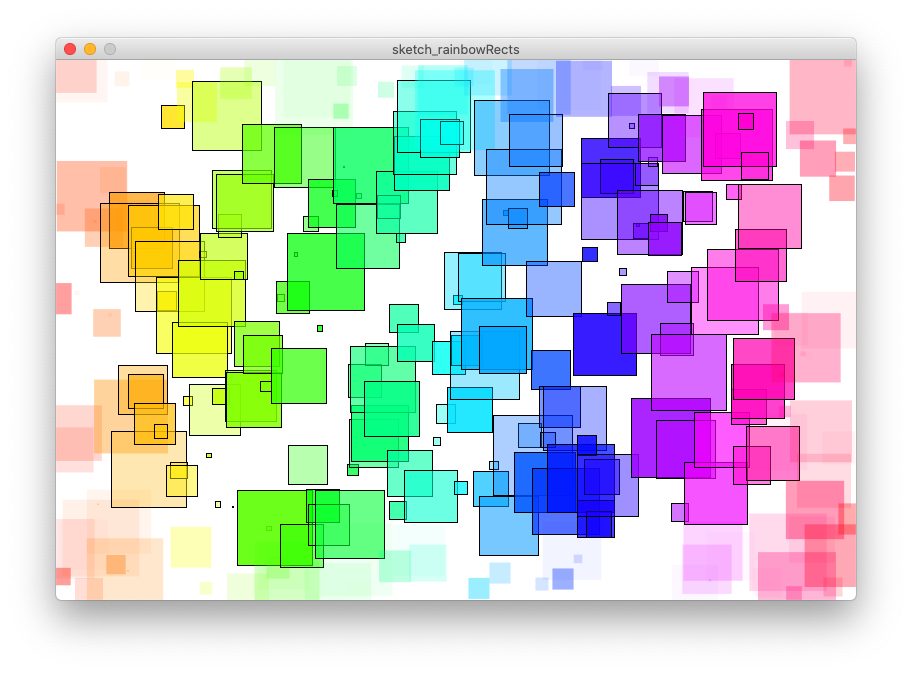
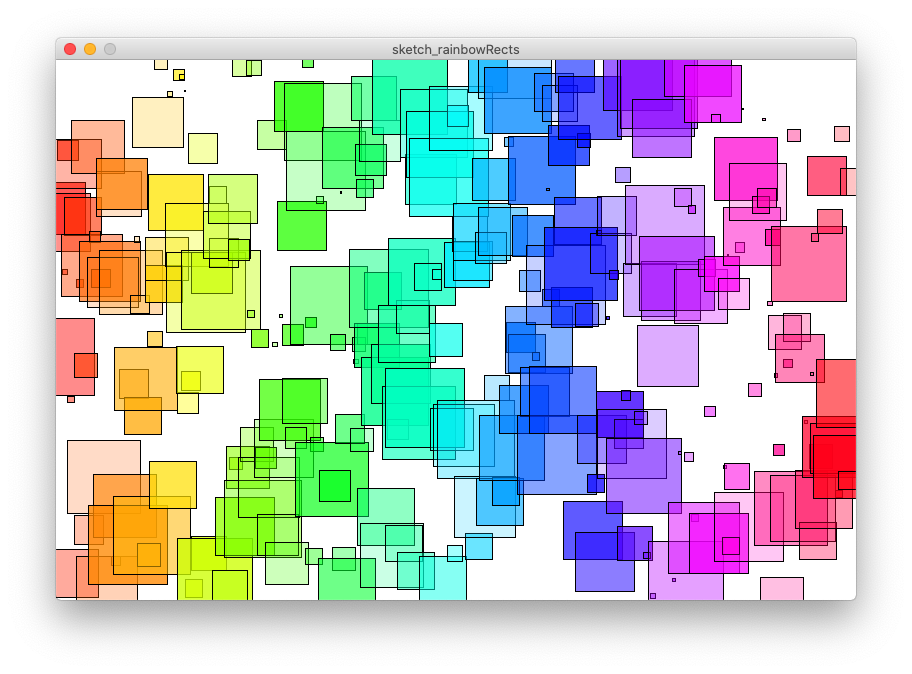
fill(myX,100,100,myOpacity);This now gives us code with a set of variables, and a while loop that is starting to do many commands.
//random sized rectangles coloured by the spectrum, with random opacity (alpha value)
size(800,540);
background(255,255,255);
colorMode(HSB,800,100,100,100);
rectMode(CENTER);
float myX=0;
float myY=0;
float mySizeAdapter = 0;
float myRectSizeMin = 1;
float myRectSizeMax = 80;
float myRectSize    = 0;
float myOpacity     = 0;

while(myX<width){
  myRectSize = random(myRectSizeMin, myRectSizeMax);
  myOpacity  = random(20,80);
  myY        = random(height);
  fill(myX,100,100,myOpacity);
  rect(myX,myY,myRectSize,myRectSize);
  myX += 3;
}
Step 4. Your turn
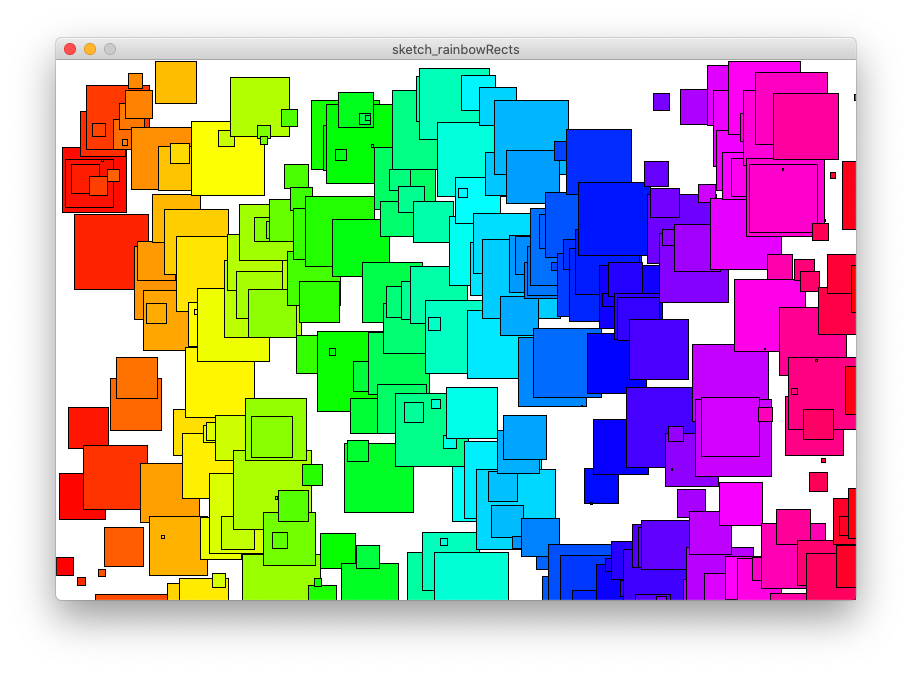
We now have a completed picture. When we run it, because we have random variables, we will create a different picture. Yours will be different. But there are many aspects you can change, or adapt. Have a go at the following:
Top tip.
To change Saturation and even Brightness you could use random(). E.g., random(0,100)
- Try changing the variable values. For instance, (1) display many more rectangles, (2) change the range of the opacity, (3) change the range of the rectangle sizes (e.g., make some really big!)
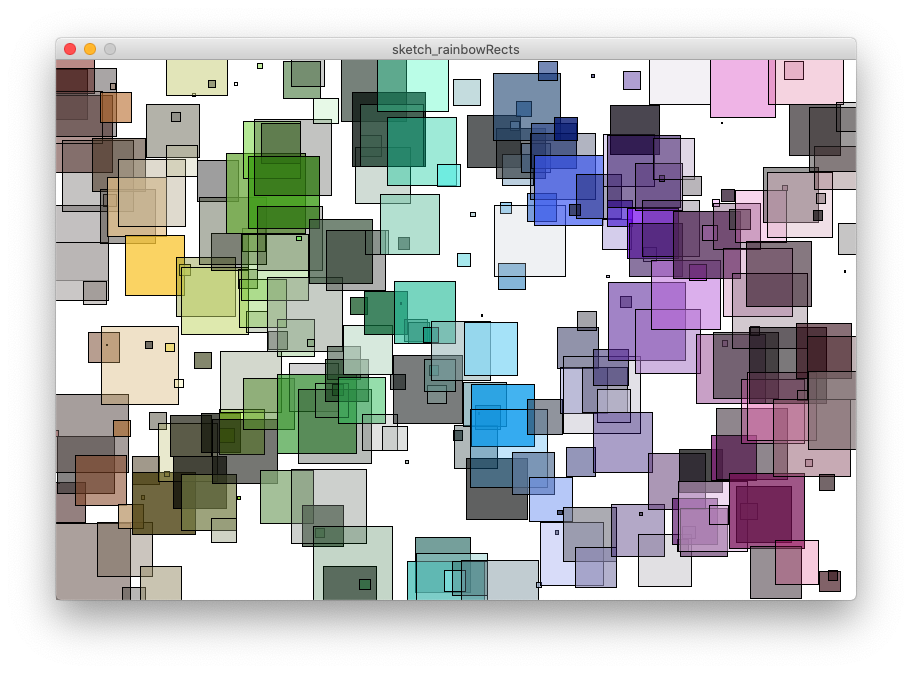
- Try changing the Brightness and the Saturation of the colours too.
Top Tip.
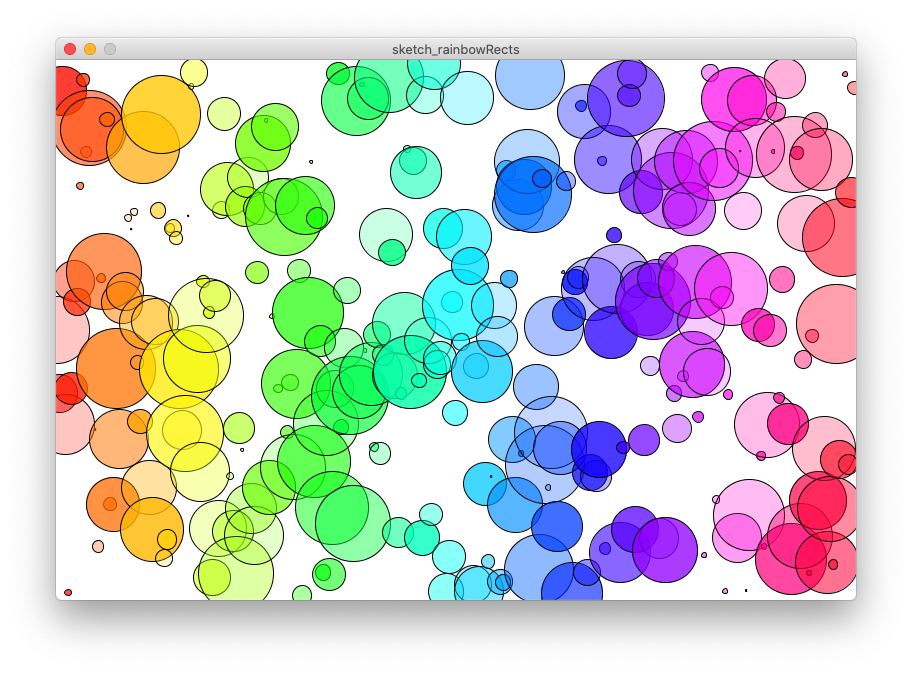
ellipse() uses the same parameters asrect().
- Swap the rectangles with circles. In Processing we can create circles by using the method
ellipse().
- Try to plot a centre region with a different appearance to the outer ones. E.g., change the stroke and transparency of the inner ones in comparison to the outer ones.
Top tip.
You will need to define the inside region using an
ifstatement and many ANDs.