In this coding activity we will use the Processing library to create a grid of coloured squares. We will use the Hue Saturation Brightness (HSB) colour model to assign the colours, which I covered in a previous activity. Consequently, this activity follows from previous ones and I suggest you achieve those activities first:
- Setting up the programming environment,
- The activity to make a quick sketch before you code, and
- Hue Saturation Brightness activities first.
- Create a spectrum of coloured squares in Processing (part 1)
At the end of this activity, I want you to realise that (in coding) it is best to separate the index (position) of each grid cell and its actual x,y plotted position. This makes code that can be easily applied to different situations.
Step 1. Plan the picture
Whatever project you are doing, it is good to know where you are heading! The Critical Thinking Sheet can help you think and plan your code.
Our activity today is to create a picture of a grid of coloured shapes, where each square is placed alongside the other.
We can think about this idea as a grid of cells, where each cell is the same size, sits next to another cell, and each cell includes one object. We could place different shapes in each cell (such as a rectangle or a circle), but let’s start by placing coloured squares. We could also change the colours of the circles to create various patterns, but let’s start simple and shade them by random colours.
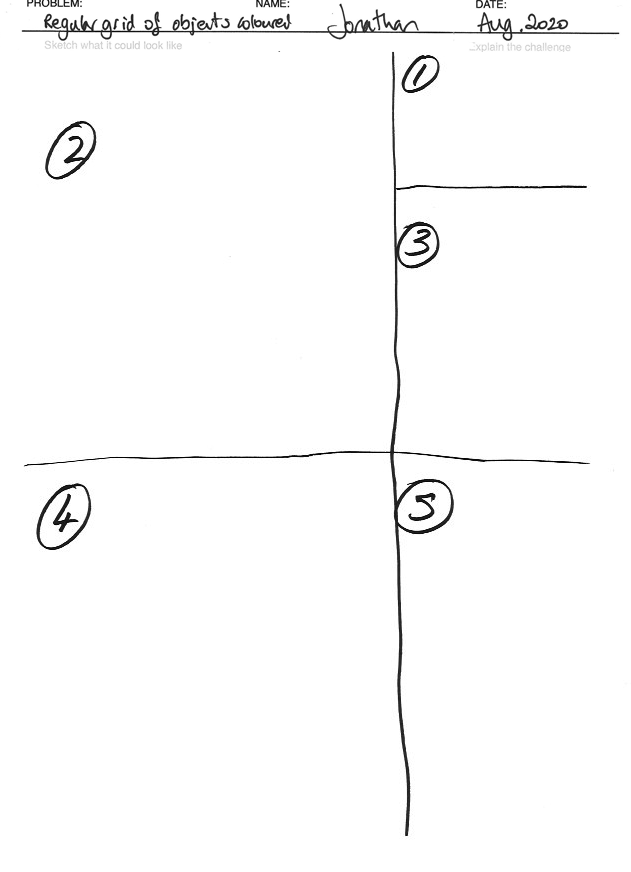
- If you have not done so already: print out the Critical Thinking Sheet. On the printout, now complete the problem, name and add today’s date. Also explain the challenge part ①
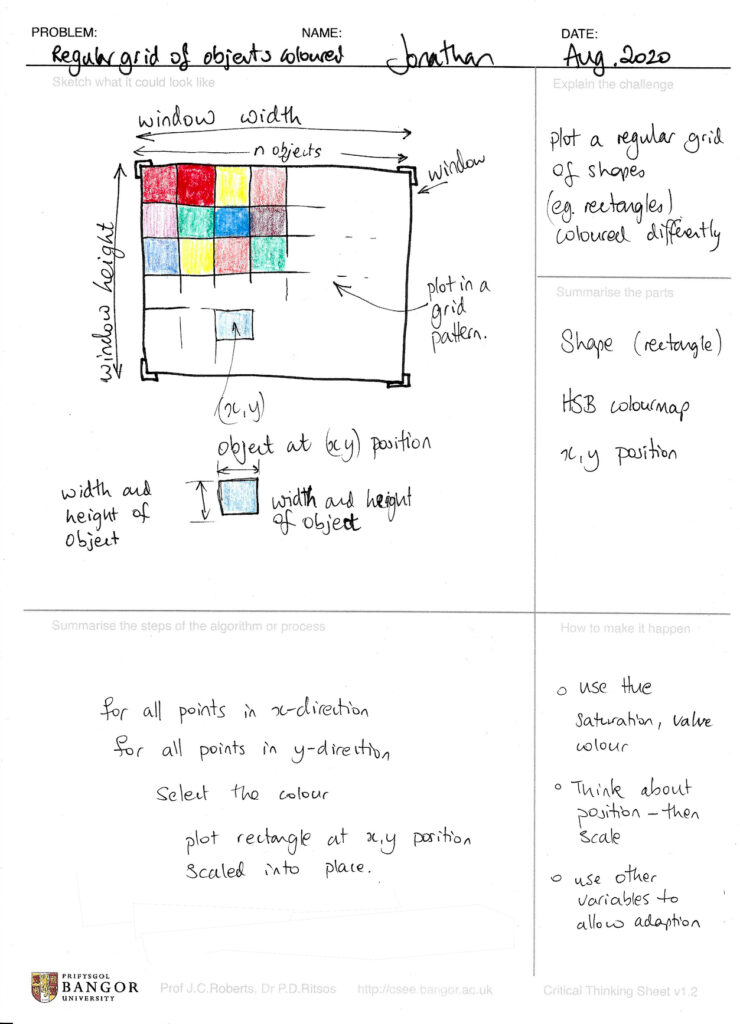
- In panel ② make a sketch of the problem output, and annotate the diagram.
- In panel ③ you can explain the main components of the system. In this challenge there are three main aspects: (i) the shape that we will plot, (ii) the colour that it will be, and (iii) the position we will place it in.
- In panel ④ we can now explain the process (algorithm). A simple process is to run through every cell position (we can do this by going through all x positions and then all y positions), then set the required colour, and finally plot the shape.
- Finally, we need to consider what to do next. Definitely we need to think more about the cell, and how to index each part, and about the colour model.
Step 2. Set up the basic window
Setting up the Processing environment with basic code should easy now.
- Set the window
sizeto 600 by 200 - Set
backgroundto white - Choose the
colorModeto be HSB, and set all values (for now) to be 100 - Plot a grey rectangle, to make sure it all works fine.
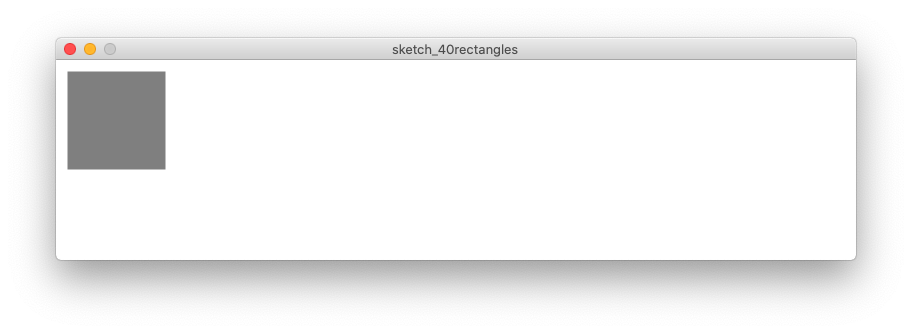
size(800,200);colorMode(HSB, 100, 100, 100);background(100);// Do a test with one rectangle// just to make sure that everything is workingfinefill(50);stroke(100);strokeWeight(2);rect(10,10,100,100);
Step 3. Understand the grid and coordinate system
Let us remind ourselves about the coordinate system in Processing.
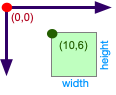
We can plot a rectangle in Processing, by describing the location of the top left position of the rectangle, and set its width and height.
Top Tip.
A unit square sets each side to be 1.
Let us assume (for now) that the width and height of the rectangle is one. This provides a really nice way to index every grid point. The first square is placed at (0,0), and then moving to the right we get the second at (1,0), third at (2,0) and so on. We are using the unit square, to simplify the code.
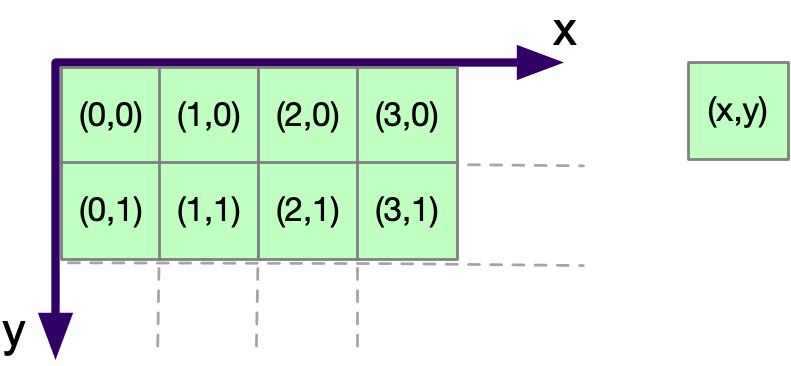
This indexing scheme fits really well with a for loop. For example we can use two for loops to index positions in a 2D grid between 0 and 9 as follows:
for(int x=0; x<10; x++)
for(int y=0; y<10; y++){
// loop code goes here
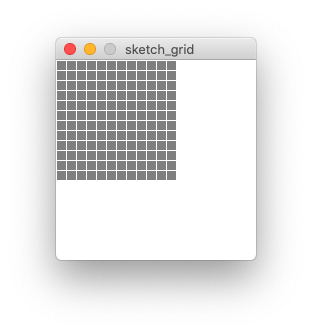
}But, if we directly plot 1 by 1 rectangles – they would be very small. Indeed, so small that they are only revealed when we zoom into the screenshot.
We need to scale everything up. In computer graphics scaling is performed through multiplication. So to scale everything by 10, we can multiple the index position x and y by 10 to get the real location, and multiple the unit rectangle by 10, to create a rectangle of 10 width by 10 height. Perhaps we want a grid of 12 rectangles by 12 rectangles, we just change the end conditions of both for-loop to 12. As follows:
for(int x=0; x<12; x++)
   for(int y=0; y<12; y++){
   rect( x * 10, y * 10, 10, 10);
}
Top Tip.
Separate the quantity of items, and how they are indexed, from their use.
This is a really good strategy: separate the quantity of the things, and how they are indexed, from their use (or in our case, their position).
Refactor the code.
Let us improve the code making it more descriptive, and remove magic numbers. To do this we need to define some variables.
- We can set
myScaleto be 10, - the
widthandheightof each rectangle to becellSize, - the size of the index could be different in X and the Y direction, so let’s define
gridQuantityX and gridQuantityY also to 10. The code to achieve this result is as follows:
size(200,200);
colorMode(HSB, 100, 100, 100);
background(100);

fill(50);
stroke(100);
strokeWeight(1);

float myScale = 10;
float cellSize  = 10;
int gridQuantityX = 12;
int gridQuantityY = 12;

for(int x=0; x<gridQuantityX; x++)
   for(int y=0; y<gridQuantityY; y++){
   rect( x * myScale, y * myScale, cellSize, cellSize);
}
Some observations with this code:
- if
cellSizeis bigger thanmyScalethen the rectangles overlap, - if
cellSizeis smaller thenmyScalethere is a small gap between each rectangle. - if the result of
gridQuantityX*cellSizeis larger than the width orgridQuantityY*cellSizegreater than the width of the window then not all the rectangles would be seen on that window.
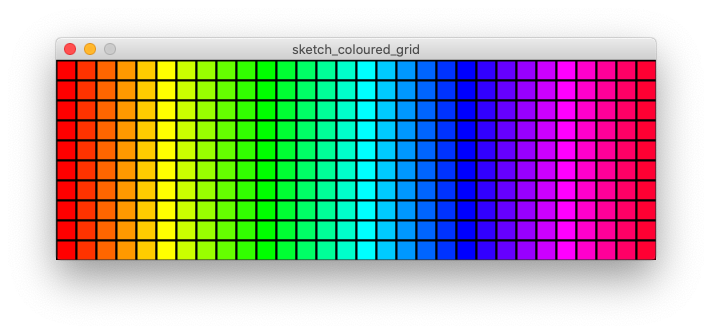
Step 5. Colour the squares and make the grid fill the window
Let’s change the code (slightly) to make the grid fill the window. We can do this by setting the rectangle dimensions, and calculating the quantity of rectangles that will fit in the window. We also need to re-organise the code order to make it work; especially set the colorMode later, when we know the colour range.
Top Tip.
Remember to refactor your code.
- set the
cellSizeto20 - Calculate the (integer) quantity of cells that will fit in the window width, by
floor(width/cellSize); - Calculate the (integer) quantity of cells that will fit in the window height, by
floor(height/cellSize); - Set the scale to the
cellSize. - Set the colourRange in the HSB space to the
xvalue of the gridQuantity; - Fill the colour based on the
xvalue.
size(600,200);
background(255);
float cellSize = 10;
int gridQuantityX = floor(width/cellSize);
int gridQuantityY = floor(height/cellSize);
float myScale = cellSize;
int colourRange = gridQuantityX;
colorMode(HSB, colourRange, 100, 100);
stroke(0); // make it black
strokeWeight(2);
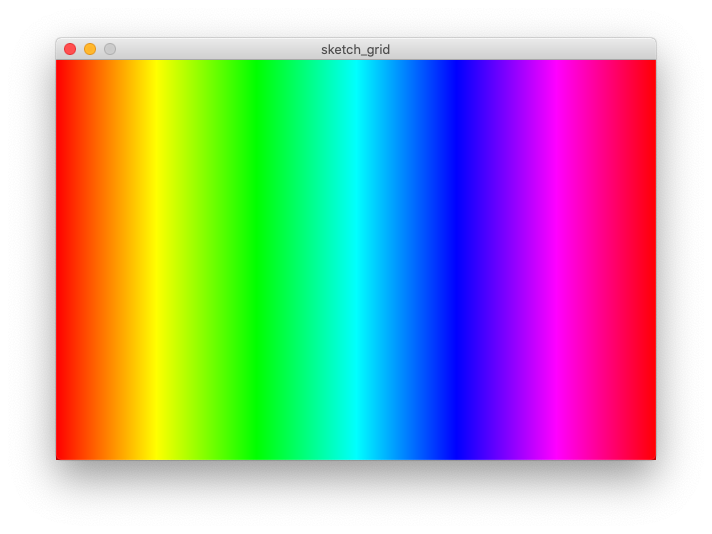
for(int x=0; x<gridQuantityX; x++)
for(int y=0; y<gridQuantityY; y++){
fill(x,100,100);
rect( x * myScale, y * myScale, cellSize, cellSize);
}
Step 6. Now your turn. Add variation and try different values
Now we can change the basic code, to make it more interesting.
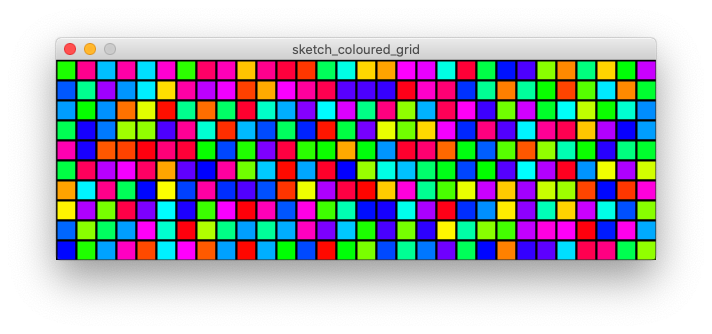
Try different colour combinations. Perhaps make them all one colour, random colours, or a small range of colours (such as light blue to dark blue.
Top Tip.
Don’t guess values for your code. Instead imagine the end result, then choose values to achieve that result!
Adapt the size of the rectangles. Try to make them bigger or smaller. Even make them really small, so that individually the rectangles cannot be seen.
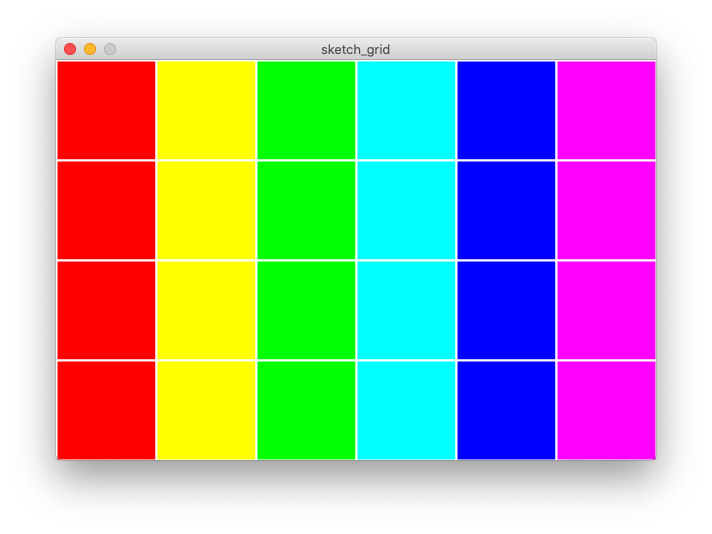
Change the stroke and appearance of each rectangle. White strokes, coloured stroke, black stroke, to noStroke.
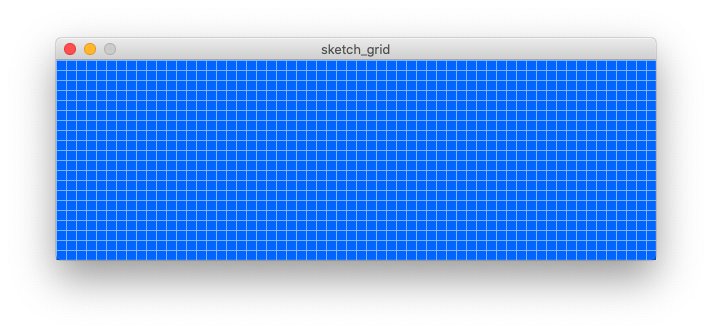
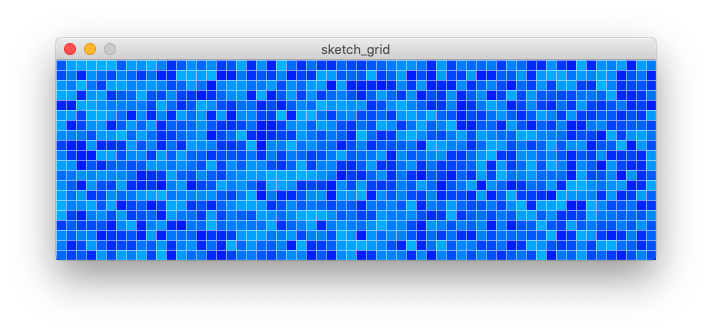
Add some noise. One thing we could add some randomness into the colour choice. Rather than plotting an exact colour, we can add or delete a random value from a fixed colour blue. We are adding a deterministic jitter to the colour value. We can easily achieve this by adding a random value to the colour. For instance, we can use a random range created by random(-5,5). By choosing a fixed colour blue, we can make a swimming pool tiling pattern, as follows:
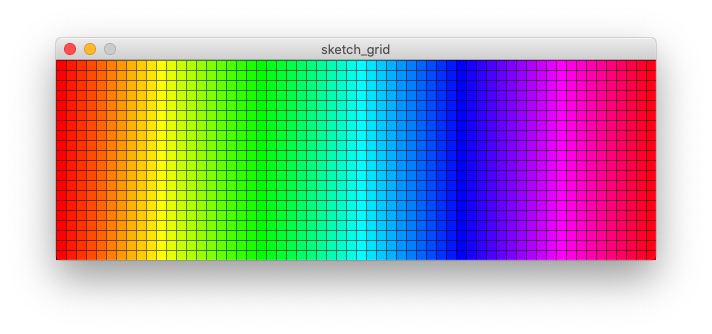
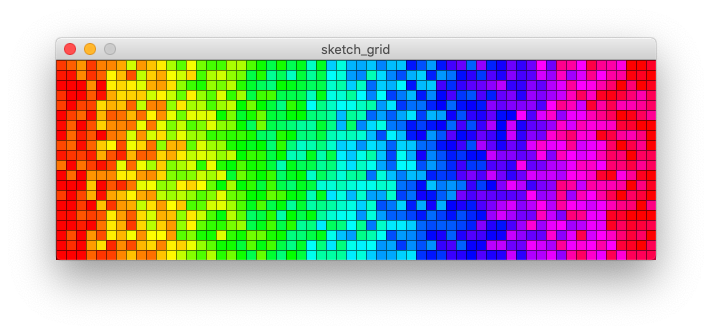
We can do the same with the spectrum colour choice: choose the spectrum colour, and then jitter the colour by +random(-5,5).
One reply on “Create a coloured grid in Processing”
Jonathan,
Thank you. I was working on a simple camera calibration and needed a good target. Your random colored grid made a great clear image. Correcting the camera colors, positions and intensities is much easier with a quantitative reference. The only suggestion I have is to also have the Javascript version. There are about 4.8 Billion people with some access to the Internet, and they all use browsers and systems that have some access to Javascript. But C requires a considerable investment in finding, learning and sharing. It does not need to be that hard (standardizing C methods of sharing for global communities of billions of people) but not without effort.
Here is my note about your page: https://theinternetfoundation.net/?p=1474
Thank you,
Richard Collins, Director, The Internet Foundation