Introduction
In this coding activity we will create hundreds of rectangles that will show a spectrum of colour. In part 1 (this part) we will create the basic code. We will use the Processing library, and the Hue Saturation Brightness (HSB) colour model. This activity follows from previous activities and I suggest (if you have not already) that you follow the following three activities first:
- setting up the programming environment,
- the activity to make a quick sketch before you code, and
- Hue Saturation Brightness activities first.
Step 1. Plan the scene
The vision is to create a splash of coloured rectangles, starting with red on the left hand side, and ending in purple on the right.
The first step is to plan the scene. This will give you a good idea of what you are going to create.
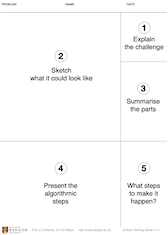
- Print out the critical-thinking sheet, and get a black pen and some coloured pens or pencils.
- Think about the task, and start to visualise how you will complete the panels.
Now complete the panels. Remember to complete the panels in the order given 1 to 5.
Top tip.
Print several Critical Thinking sheets to have some spare.
- In panel (1) summarise your task in your own words
- Sketch your ideas, and remember to add labels.
- Write the main components of the task. E.g., we will need some rectangles, the HSB colour model, and some random value to plot the rectangles.
- Write the main steps. How to start, progress from one step to another, and then end.
- Finally, think what you need to do now. For example, look at the HSB model.
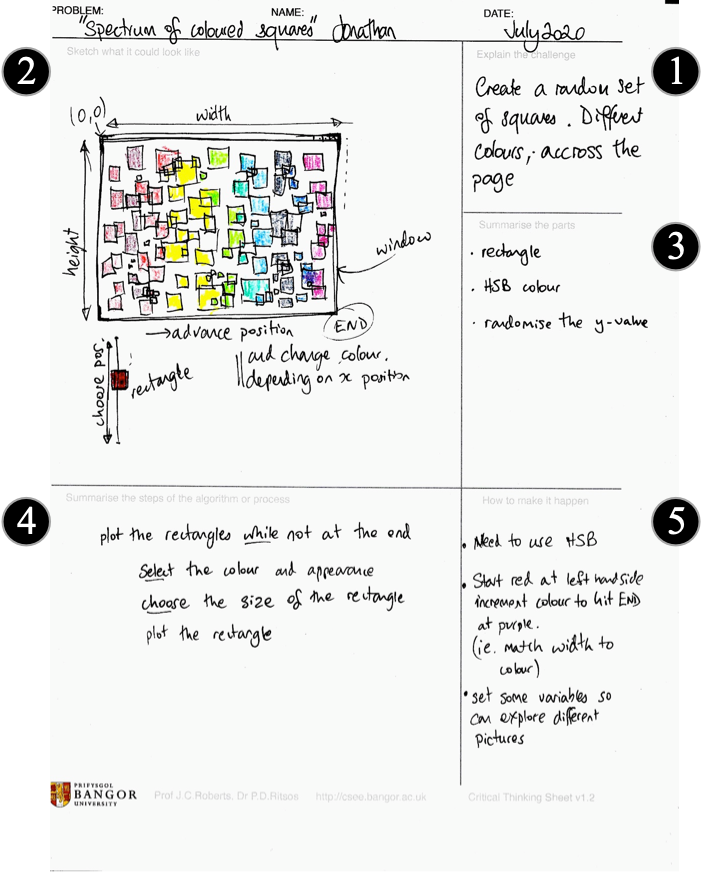
Here is my example.
Step 2. Setup the window, colour model and variables
Set up the drawing window. Open Processing, and set to the size to 800 by 540 and the background to white, as follows:
size(800,540);
background(255,255,255);
Now we need to select the colour model to use. In this activity it is much easier to use the Hue Saturation and Brightness (HSB) model.
In Processing, we change the colour mode by colorMode. This method allows us to define Red Green Blue (RGB) or Hue Saturation Brightness (HSB) modes. We can also select the values for each range of colour. There are two main ways to use this method, the first is to define only two parameters:
ColorMode(mode, max);
modedetermines whether you are using RGB (red green blue) or HSB (hue saturation brightness).maxsets the range of all colour elements.
The second is to select many more parameters, to be able to individually change (say) the ranges for Red, Green and Blue, or Hue Saturation and Brightness, separately.
ColorMode(mode, max1, max2, max3, maxA);
mode, as before determines if you are using RGB or HSB.max1with RGB mode explains the range for the Red values. When the mode is HSB, max1 describes the range of the Hue values (often this is 360, but other values may be suitable).max2sets the range for either Red or Saturation depending on the mode.max3sets the range for Blue or Brightness depending on the mode.maxAprovides the range for the opacity of the colour; this is known as the alpha value of the colour. Often the alpha parameter is a number is set between 0.0 (fully transparent) to 1.0 (fully opaque).
In our case, we need to set the mode to HSB, and to set values for max1, max2, max3 and maxA.
We could set max1 to 360 (because it is traditional to have the hue range from 0 to 360, from the colour wheel), but – for our purpose – there may be a more convenient values to set it to! We might as well match the length of the window to the quantity of colours. By setting it this way, we don’t need to calculate how far across we are, because the distance is the same as the colour we would allocate! We set the other values (max2, max3, maxA) all to 100, so that they range between 0 and 100.
colorMode(HSB,800,100,100,100);Just to note that when you choose the colour mode it will stay with that specification until you change it back. To change it back to RGB, set back to the usual 255 ranges, colorMode(RGB, 255, 255, 255).
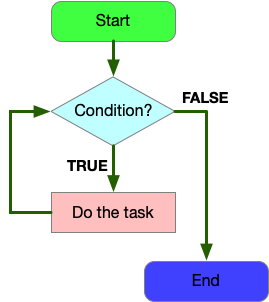
Step 3. Create many rectangles, use a while loop
It is easy to plot one rectangle. For example, to plot a rectangle of (0,50) with 10 width and height, we write rect(0,50,10,10). But we want many across the page. We can use a while loop to achieve this. The while loop continues doing the task, while the test is true.
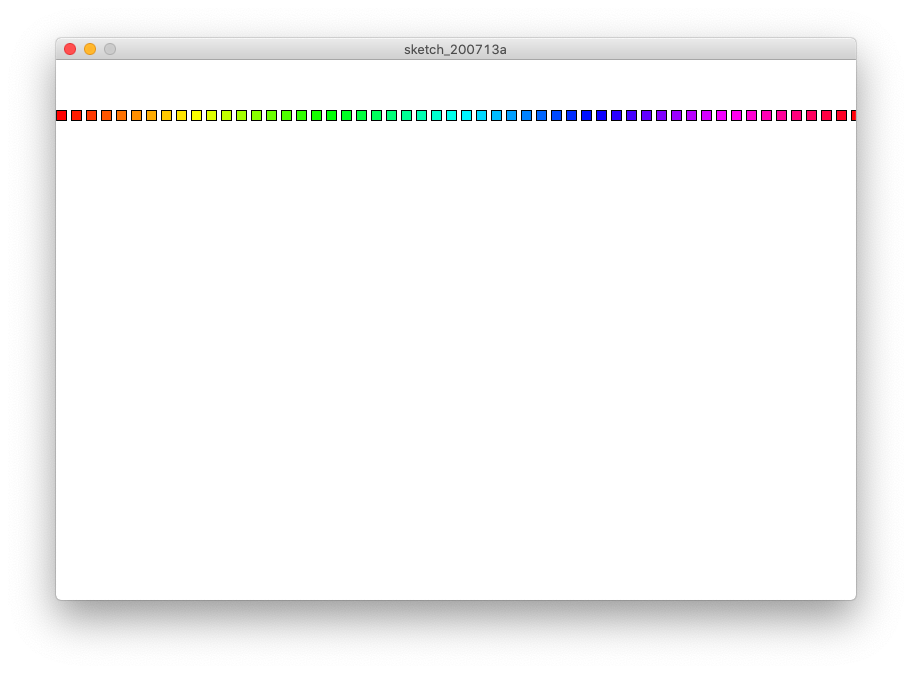
Let’s start drawing red rectangles across the page.
Top Tip.
width and height (in Processing) hold the width and height of the page!
Start. We need a variable to hold the current x position, and to give us something we use in our condition test. Let’s call it myX, and set it to 0 (the left hand side of the page).
Condition. We need to test if we have reached the most right point of the page. We can test if the x value is less than width. So we write (myX<width).
Do the task. We need to do three things: set the colour, draw the rectangle, and increase the myX counter so we get ready for while loop test.
- Because we are using HSB and the hue range is set to 800, and the width of the page is the same size, we can use the
myXfor both position and colour. We write:fill(myX,100,100); - Next we draw the rectangle,
rect(myX,50,10,10);Just for now have the rectangle at y=50, and a 10×10 rectangle. - Finally need to move the position forward (so we can test it the next time round the loop)
myX=myX+15;We use 15 here because it is slightly larger than the width of the rectangle.
// Rainbow of squares across page
size(800,540);
background(255,255,255);
colorMode(HSB,800,100,100,100);
float myX=0;

while(myX<width){
  fill(myX,100,100);
  rect(myX,50,10,10);
  myX = myX + 15;
}
Top tip.
This is a good coding principle: (a) start with simple code, (b) get it working, and (c) add to it.
Step 4. Create random rectangles
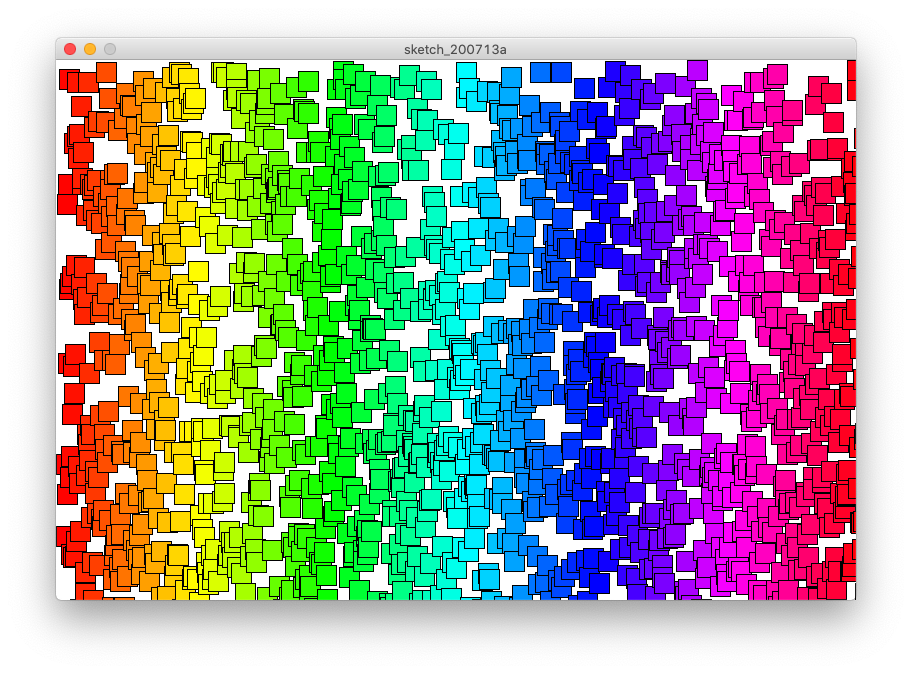
Now we have completed the basic code, we now need to alter the y value of the rectangles. We shall do this in three steps.
First, we need to change line 9 (above) to alter how the rectangles are plotted. We make the y value for the rectangle to be a random value between 0 and height.
Second, we should make the rectangles a bit bigger, let’s have them at 20×20.
rect(myX,random(height),20,20);Third, we change the increment (line 10). We need to have many more squares. Rather than adding 15, let’s add something much smaller. Let us try 1, or even 0.5. We can also shorten the command myX = myX + 0.5; to the shorthand version of myX += 0.5;
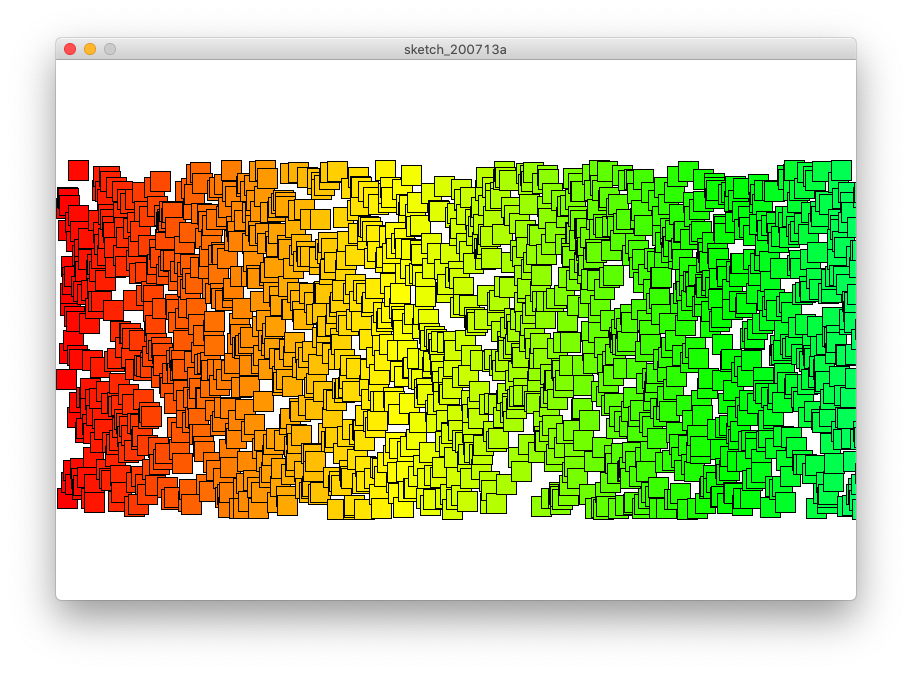
myX += 1;This now gives us a set of rectangles across the page, which are randomly positioned (in the y), and the rectangles show the colour spectrum.
//Rectangles coloured by the spectrum
size(800,540);
background(255,255,255);
colorMode(HSB,800,100,100,100);
float myX=0;

while(myX<width){
  fill(myX,100,100);
  rect(myX,random(height),20,20);
  myX += 0.5;
}
Now the final part is to save this version. In part 2 we will extend this activity. Goto File>Save, and save the sketch. Name it (something like) sketch_rainbowRects.
Your turn
Now you can try out different values and different settings.
- Change the increment value of myX. For example, change it to 0.2, or 1.
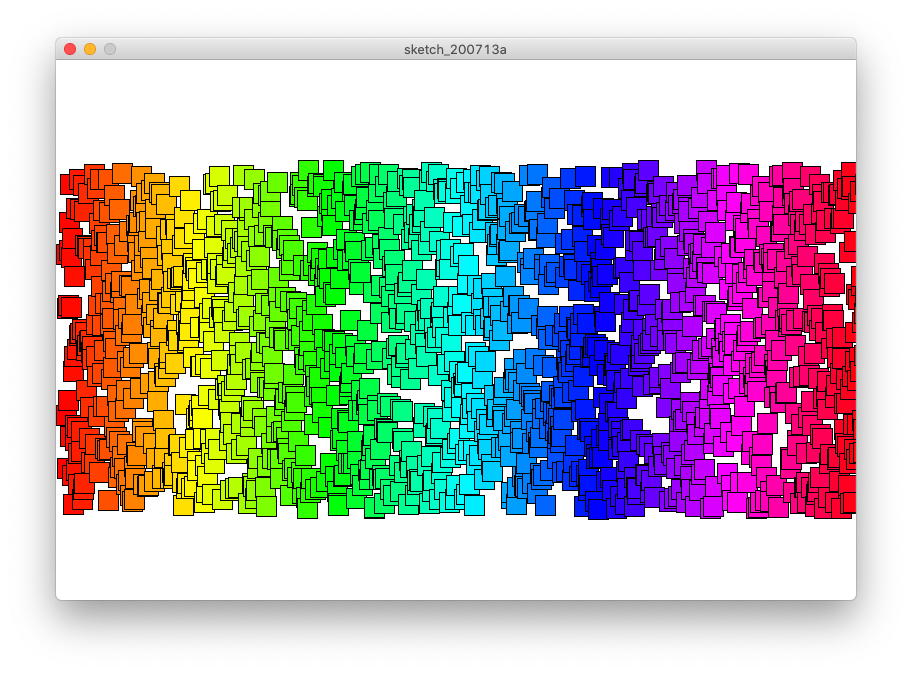
- Try to make it draw within a middle range (between, say, 100 and 450).
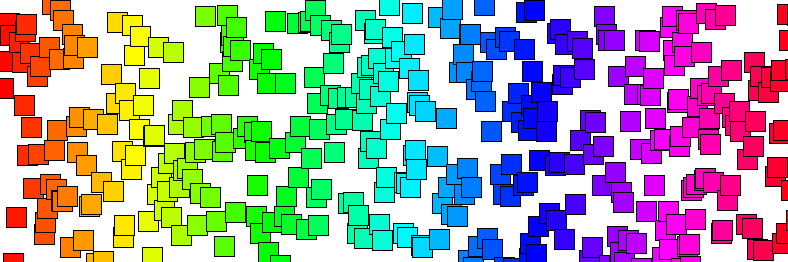
- Try to change the colour range so that it spreads from red to green over the page.