Introduction
We have already introduced the RGB model to code colours on a computer. In that post I said:
“We can either represent a colour in values of Red, Green and Blue (known as RGB colours), or a distance travelled along a continuous hue rainbow.“
Now we will focus on coding colours through Hue, Saturation and Brightness (HSB).
Why another way to code colours?
One simple answer is that sometimes one way is better than another. In some situations RGB may be easier for a programmer to code, whereas in other situations it may be better to use the HSB model, in comparison to the RGB or others. Consequently, it is good to understand different coding methods.
Top tip.
RGB = red, green blue.
HSB = hue, saturation and brightness.
In fact, there are many ways to code colours onto a computer. Back in the early days of computing, in the 1960’s and 1970’s, computer pioneers wanted a way to consistently record and reproduce colour. They needed ways to code colour such that it could be displayed on a computer screen, transmitted over airwaves, and so on, in a consistent, convenient and accurate way. HSB is also known as Hue, Saturation and Value model (HSV) and was invented in 1978 by Alvy Ray Smith.
Coding is another way of saying “let’s change the phenomenon into a way we can store it and manipulate it on a computer”. Consequently, colours need to be changed into numbers and letters. On a computer we have many methods to store values: we can use floating point values, percentages (values ranging from 0 to 100), or values between 0 and 1, even a mix of letters and numbers. In RGB we store a colour by values (between 0 and 255) for each of Red, Green and Blue (e.g., rgb(125, 255, 25).
Not only are there different ways to code colours, but there are different ways to consider colours. For example, we can understand colour from mixing lights, thinking about light wavelengths, how paints are mixed, how we perceive colours, or even naming individual colours. Consequently, there are different ways to represent colour. None of these ways of “thinking about colour” are better than the other; but they may be better for specific purposes.
Scientists, however, do need ways to express their ideas, and create colour models that abstractly describe their ideas, and define colour spaces to present their ideas.
Colour models are abstract representations of colour. Usually they include a precise description and mathematical equation to express the colour concept, and a picture of the model to help us visualise the idea.
The colour space allows us to understand one model in comparison to another. Perhaps we can find a way to map the colour model into two-dimensional coordinate system, or a three-dimensional picture. These spaces not only help us visualise the colour model, but help us to compare one model against another.
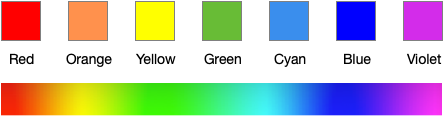
Throughout history many colour models have been invented. But they have been done for one purpose: to help people understand colour better. Much of our understanding of colour begins with Isaac Newton (1642-1726). Newton used a prism to split light into its colour spectrum. He named the colours red, orange, yellow, green, blue, indigo and violet (see colours and rainbows).
Newton created his own colour wheel to represent these colours. He ordered the colours in the order of the spectrum. But he created uneven intervals based on musical notes.

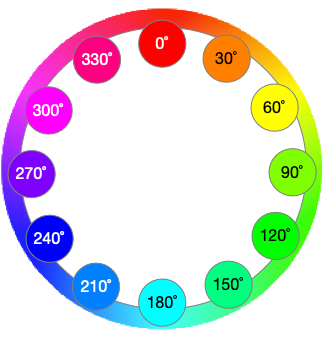
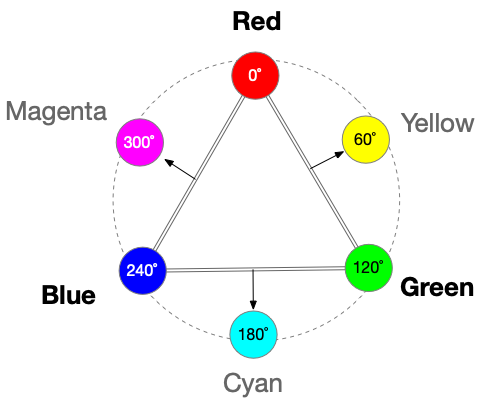
For the HSB model, we position red at the top, and the spectrum colours around the circle. Let’s now go through each of the parts: Hue, Saturation and Brightness.
Hue
In the HSB model, hue is denoted by an angle around the circle. Red is placed at the top at 0˚, yellow-green at 90˚, cyan at 180˚, and purple at 270˚. By changing the angle, we can choose a specific hue.
Top tip.
Try to remember some of the angles. Red at 0˚, yellow 60˚, green 120˚, cyan 180˚, blue 240˚
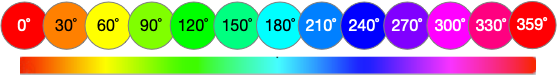
When you are using different computer programs (such as a photo editor) you may need to choose colours through a colour picker. In some colour pickers, the wheel is flattened into a long rectangle of colours. But the hues are still given a value between 0 and 360.
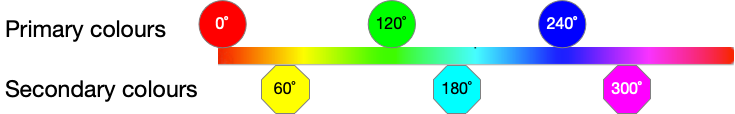
If we look further, we can see the principles of light mixing at work! The primary hues of red, green and blue are equally separated around the circle: red at 0˚, green at 120˚ and blue at 240˚.
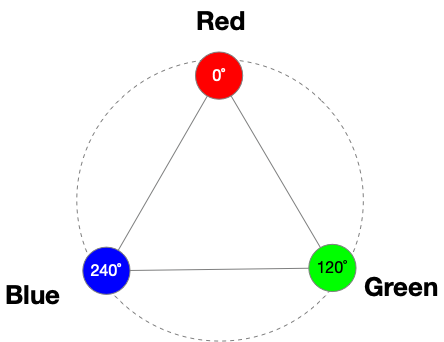
The secondary hues, cyan, magenta and yellow, are then seen in between. When we mix red and green light we get yellow, blue and green light produces cyan, and red and blue light produces magenta.
Top tip.
Try to memorise the colour wheel positions of both the primary and the secondary colours.
Saturation
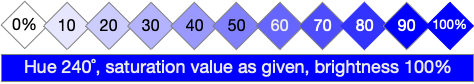
Saturation is the intensity of the colour: the richness of the colour. At zero there is no colour and white is shown, at 100 there is pure hue. Let’s choose a hue value of 240˚ to get a deep-blue colour, we can then change the saturation levels by 10% starting at 0%.
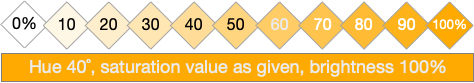
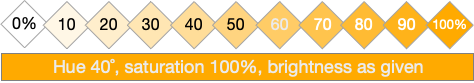
We can do the same with a value of orange. Starting with no colour and moving towards the full colour hue.
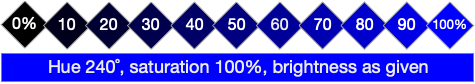
Brightness (or value)
Brightness is the brightness of colour! If the colour is not bright then we have the darkest version of that colour (it will look black). And when we have the brightest colour we get the hue itself in its purest form.
HSB (HSV) model space
We can think about the HSB model in a three-dimensional visualisation. In 3d, the colour model looks like a cylinder, with the hue around the side, saturation towards the center of the cylinder and brightness from the top to bottom.
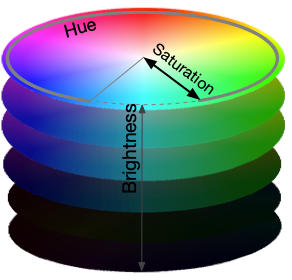
This model helps us understand how we can manipulate the values.
- By increasing the hue value, we rotate around the circle clockwise. If we decrease hue we rotate anticlockwise.
- If we decrease saturation we move into the center of the cylinder. This results in a less-saturated version of that colour.
- To decrease the brightness (making the colour darker) we are moving down the cylinder. Move upwards to increase the brightness.
HSB and colour interfaces (colour pickers)
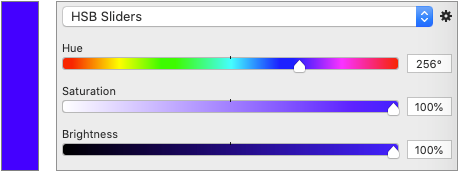
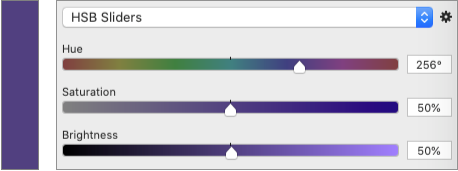
While the cylinder is a useful way to visualise the HSB colour model, practically it’s not very easy to manipulate colour in 3d. So, colour pickers use sliders and buttons to control the colour.
Using three sliders to control HSB.
Each slider therefore represents one of Hue, Saturation and Brightness (or value).
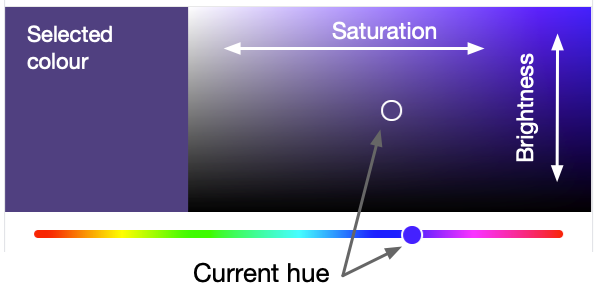
Plotting in two-dimensions
Another approach is to plot two dimensions of the colour, and have the third represented by a slider. So, for example, we can plot Saturation against Brightness, and have the colour hue on a slider. In this way you can select the “current hue”. Then all the shades are mapped on a 2d grid, with saturation on the x-axis and brightness on y-axis. White is plotted on the top left and black along the bottom.
Activities
In these activities we will use the Google colour picker, and the main aim is for you to practice using the HSB model.
Step 1. Load the Google colour picker
To access this tool, go to a browser window, and in the browser load a search bar, such as the Google search bar, and type “google colour picker“. If you are using the Google search engine then “colour picker” would be enough. This should load several search results on colour, and depict the colour picker at the top. Let’s just focus on the colour picker interface.
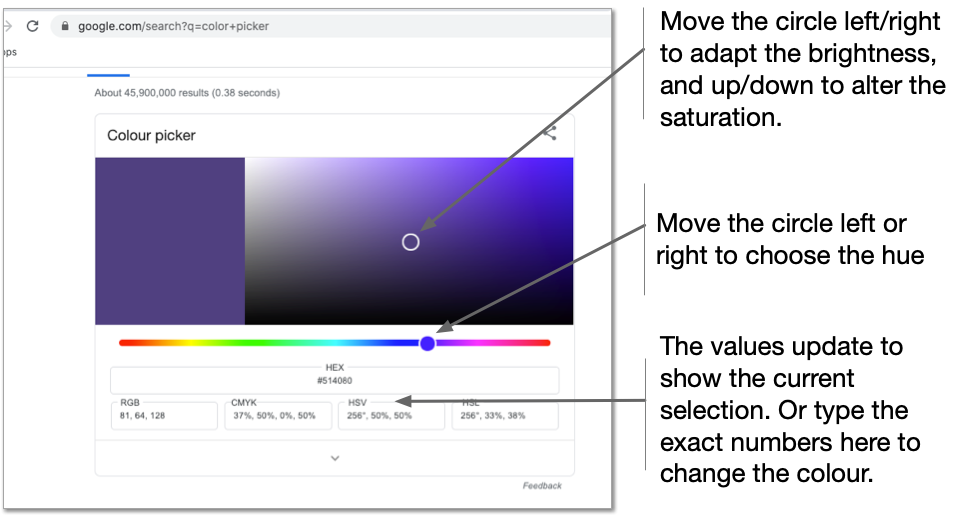
Note. the Google colour picker also shows the colour values in three other colour models. It shows values in RGB, CYMK, HSB and also HSL colour spaces; but let us focus on HSB values.
Step 2. Locate the primary and secondary colours
Now try to locate the primary and secondary colours.
- Find, the primary colours: red, green and blue. By moving the circle, or changing the values in the text fields, locate the primary colours (red, green and blue). You will need to put the brightness and saturation to maximum.
- Find the secondary colours: yellow, cyan and magenta. Try to get the exact values of 60˚, 180˚ and 300˚ respectively.
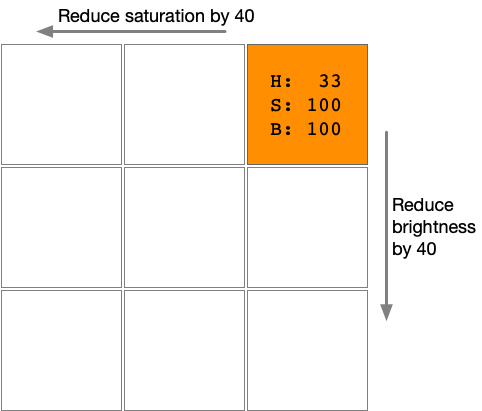
Step 3. Investigate brown
Find a colour brown at 33˚. And set both saturation and brightness to 100%. The idea is to investigate how the colours change when you alter saturation and brightness.
The task is to reduce the saturation by 40 and then the brightness by 40. And to make a grid of colours.
Look further
How about doing your own research on colour.
- Perhaps take a look at different colour models and where they are used.
- Look at colour pickers, and see how they are used.
- Try to remember some of the colour values and their values in the HSB colour model.